In this post I will demonstrate how to add MiniProfiler to the XAF MainDemo web application.
MiniProfiler is a simple fast profiler with a pretty user interface. It is fast because it only profiles code that you have explicitly decorated with the MiniProfiler.Step() method. It was designed by the team at StackOverflow.
First, add the MiniProfiler NuGet package to the MainDemo.Web project. Then add a placeholder to default.aspx just before the last <body> tag.
12345678
<!-- MiniProfiler --><!-- Include jquery here to avoid a bug in MiniProfiler. --><script src="https://ajax.googleapis.com/ajax/libs/jquery/1.7.1/jquery.min.js"></script><asp:PlaceHolderID="mp"runat="server"><%= StackExchange.Profiling.MiniProfiler.RenderIncludes() %>
</asp:PlaceHolder></body></html>
(MiniProfiler uses jQuery, but it does not usually require XAF to include it since it will automatically retrieve it if missing. Unfortunately there is currently a bug which causes a ’jQuery is undefined’ javascript error when initially launching the application. The easiest workaround I found is to explicitly include jQuery before calling RenderIncludes(). Hopefully this will be fixed in a future version of MiniProfiler.)
In global.asax.cs add the following to the Application_Start method.
Now we implement a helper class which determines whether profiling is enabled and which URLs to profile. We can use a variety of methods, the cookie probably being the most versatile one, but for the moment, the IsEnabled() function always returns true.
publicstaticclassMiniProfilerHelper{publicstaticboolIsEnabled(){// While we are testing let's always return truereturntrue;// We should not profile if we are EasyTestingif(TestScriptsManager.EasyTestEnabled==true)returnfalse;// We could choose to profile only local requestsif(HttpContext.Current.Request.IsLocal)returntrue;// Or based on a cookieHttpCookieminiProfileCookie=HttpContext.Current.Request.Cookies["MainDemoMiniProfiler"];returnminiProfileCookie!=null&&miniProfileCookie.Value!="0";}// Optionally ignore some paths to prevent the output being too busy.publicstaticvoidRegisterPathsToIgnore(){if(!NetSecuritySettings.IsProfilingAllowed())return;List<String>ignoredByMiniProfiler=newList<String>(MiniProfiler.Settings.IgnoredPaths);// these are a substring search so wildcards are not supportedignoredByMiniProfiler.Add("SessionKeepAliveReconnect.aspx");ignoredByMiniProfiler.Add("TemplateScripts.js");ignoredByMiniProfiler.Add("EasyTestJavaScripts.js");ignoredByMiniProfiler.Add("MoveFooter.js");ignoredByMiniProfiler.Add("ImageResource.axd");MiniProfiler.Settings.IgnoredPaths=ignoredByMiniProfiler.ToArray();}}
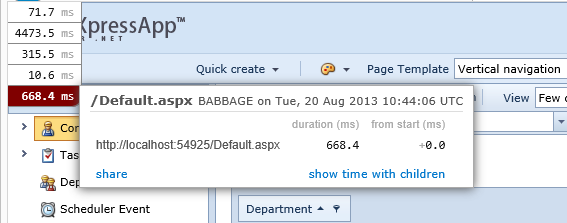
Done. Now whenever you run the web application, you get timing statistics for the loading of the assets. They appear as little clickable ‘chiclets’ in the top left of the browser page.
However, the real strength of MiniProfiler comes with the ability to add your own profiling steps. Let’s say we want to know exactly what percentage of the load takes place in the OnLoad event. Then we add the following to default.aspx.cs in order to add a ‘step’ to the MiniProfiler breakdown.
12345678
protectedoverridevoidOnLoad(EventArgse){varprofiler=MiniProfiler.Current;// it's ok for this to be nullusing(profiler.Step("ASP.NET: Page_Load(Default)")){base.OnLoad(e);}}
Now, the output is a good deal richer. Also, note that if the MiniProfiler assembly is missing from the web application’s bin directory, the profiling is ignored completely without error.
As another example, let’s profile the FindBySubject controller action.
Add the MiniProfiler NuGet package to the MainDemo.Module project. Then modify the FindBySubjectController.cs as follows
12345678910111213141516171819
private void FindBySubjectAction_Execute(object sender, ParametrizedActionExecuteEventArgs e)
{
+ var profiler = MiniProfiler.Current;+ using (profiler.Step("FindBySubject")) // doesn't matter if profiler is null+ { IObjectSpace objectSpace = Application.CreateObjectSpace();
string paramValue = e.ParameterCurrentValue as string;
if (!string.IsNullOrEmpty(paramValue))
{
paramValue = "%" + paramValue + "%";
}
object obj = objectSpace.FindObject(((ListView)View).ObjectTypeInfo.Type,
new BinaryOperator("Subject", paramValue, BinaryOperatorType.Like));
if (obj != null)
{
e.ShowViewParameters.CreatedView = Application.CreateDetailView(objectSpace, obj);
}
+ }}
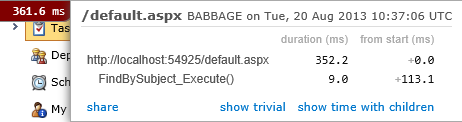
Now navigate to the Tasks list view and enter some text where it says ‘Type Subject…’. You should see a new chiclet appear which contains the timing details as shown here.
MiniProfiler is a great tool for providing helpful profiling benchmarks, even in production. It’s often difficult to measure when a remote user complains to support that the site seems slow. How slow is slow? In a production environment, you can turn on MiniProfiler for the user (by setting a cookie for instance) and then ask them to share their profiling information for some basic operations. This information can be invaluable in determining where the fault lies.