ZeroSharp

Robert Anderson's ones and zeros

Removing the RSS Subscription Icon From Octopress

| Comments

A fellow Octopress blogger recently asked how I removed the RSS subscription icon from the Octopress navigation bar.

First, create a new site variable show_feeds by adding a line to the _config.yml file which is in the root folder of the Octopress source.

_config.yml
1
2
3
4
5
6
  # RSS / Email (optional) subscription links (change if using something like Feedburner)
+ show_feeds: false
  subscribe_rss: http://feeds.feedburner.com/zerosharp
  subscribe_email:
  # RSS feeds can list your email address if you like
  email:

Then modify the source/_includes/navigation.html as follows

navigation.html
1
2
3
4
5
6
7
8
9
10
11
12
13
14
15
16
17
+ {% if site.show_feeds %}
  <ul class="subscription" data-subscription="rss">
    <li><a href="http://feeds.feedburner.com/zerosharp" rel="subscribe-rss" title="subscribe via RSS">RSS</a></li>
    {% if site.subscribe_email %}
      <li><a href="" rel="subscribe-email" title="subscribe via email">Email</a></li>
    {% endif %}
  </ul>
+ {% endif %}
  {% if site.simple_search %}
  <form action="http://google.com/search" method="get">
    <fieldset role="search">
      <input type="hidden" name="q" value="site:ZeroSharp.github.com" />
      <input class="search" type="text" name="q" results="0" placeholder="Search"/>
    </fieldset>
  </form>
  {% endif %}
  {% include custom/navigation.html %}

Then you can toggle the visibility of the feed icon by changing the show_feeds setting in the _config.yml file.

Making XAF Reports Even Better - Part 2

| Comments

Good news. The conversion is now two-way. Get the source code from GitHub. Make sure you have built MainDemo.Reports project.

You will find there are now two T4 transforms in the project. RepxToCSharp.tt is covered in the Part 1. It searches for any .repx files in the solution and converts the scripts into compilable C#.

The second transform is new. CSharpToRepx.tt copies any changes to the script part back into the original .repx files. Again, there are performance optimisations via checksums to prevent overwriting unchanged files.

1
2
3
4
5
6
7
8
9
10
(This is an automatically generated file which should be excluded from version control)

Summary of C# transformation
============================
Total C# files found                                        :  2
  Total reports injected                                    :  1
  Total reports missing                                     :  0
  Total reports skipped because unchanged                   :  1

Time elapsed: 00:00:02.3483264

Repx files with embedded scripts are now much more maintainable. You can correct syntax errors, refactor, version control, merge versions easily. You could even write unit tests against the code in the scripts.

Currently the easiest way of running these scripts is to open them and save them with Ctrl+S. This is because T4 templates were originally designed as a Visual Studio tool.

In the future I’m hoping to improve the integration further. There are ways of including the transformations into the build instead, most of which are covered in a blog post by Mr T4, Oleg Sych. I like the idea of it being a NuGet package that can be easily added to any XAF project, but there’s a but I’ll need some more time to work out how best to achieve this.

Basic usage summary

Until then, here are some basic usage instructions.

  • Add the T4 Toolbox extension to Visual Studio
  • Add a copy of the MainDemo.Reports project to your own solution
  • Make sure you build it before running the transforms
  • Open RepxToCSharp.tt in Visual Studio.
  • Save it with Ctrl+S to run the transform. It will search all the folders in your Solution for .repx files and add corresponding C# classes.
  • Make any changes you like to the script section (anything outside of // -- Start of embedded scripts -- and // -- End of embedded scripts --) will be ignored.
  • Open CSharpToRepx.tt and run it with Ctrl+S. The changes will be saved back to the corresponding .repx.

Even more power?

You may notice that if you reload the MainDemo.Reports project, you can now see View in Designer in the context menu when you right-click on the .repx.cs file.

Let’s click it and see what happens. It opens directly in Visual Studio (like an XtraReport).

Now, this is all highly experimental. You can see there are some warnings… Also, there is no connection with XPO, so the Preview is always empty.

That said, it doesn’t seem like too much of a stretch to eventually allow far more Visual Studio integration for XAF reports…

Making XAF Reports Even Better - Part 1

| Comments

The ability to create reports using a report writer is a very powerful feature of DevExpress XAF, but there are some limitations which are particularly cumbersome to deal with in complex project.

One of the projects I work on has over 100 reports in it. Even though we make use of unit tests to ensure they are not broken, the maintenance of the code in the embedded scripts is particularly difficult to manage.

  • XafReports are .repx files which are usually loaded into the report table during the database update routine. They are a subclass of XtraReports which with some added restrictions.
  • Any scripts are stored as a string or serialized to a resources property.
  • The report writer is available only in the Windows Forms application. This must be used whenever a change is made to a report. The modified report must be exported as a repx file and then added to the module as an embedded report. The procedure is described here.

These aspects of XAF reports give rise to several development headaches.

  • While script syntax can be checked within the report writer at design time (via the Validate button in the scripts tab), the script code is still brittle.
  • Errors that result from Script syntax are sometimes only discovered at run time (you can write a unit test to check during build, but we really want to the compiler to tell us).
  • Refactoring any classes requires a considerable amount of work with the report writer in order to apply any changes to the code within the scripts.
  • There is no Intellisense in the report writer.
  • Version control diff comparisons and merging are impossible.

The aim of these posts is to provide a two-way conversion process between .repx and C# files. In order to accomplish this we’ll be relying on Visual Studio’s excellent T4 templating engine.

Installing T4Toolbox

T4 Text Transformation Toolkit is a template based code generation framework which is included with Visual Studio. On top of this Oleg Sych provides a Visual Studio extension called T4 Toolbox which adds some additional features.

Install T4 Toolbox by selecting Tools/Extensions and Updates from Visual Studio and searching for it.

The ReportSync MainDemo

Next, download the modified MainDemo application from my GitHub repository and open it in Visual Studio.

First lets look at the embedded reports which I have modified slightly so that they include scripts. I added these scripts via the MainDemo.Win application.

Let’s look at the ContactsGroupByPosition.repx file. You will find that there is a section:

1
2
this.ScriptsSource = "\r\nprivate void xrLabel4_BeforePrint(object sender, System.Drawing.Printing.PrintE" +
    "ventArgs e) {\r\n\txrLabel4.Text = xrLabel4.Text + \" Test!\";\r\n}\r\n";

In this case, the script has been saved as a string. The other report, which has only slightly more complex script code looks like this:

1
2
3
4
5
6
7
8
9
10
11
private System.Resources.ResourceManager resources {
    get {
        if (_resources == null) {
            string resourceString = @"zsrvvgEAAACRAAAAbFN5c3RlbS5SZXNvdXJjZXMuUmVzb3VyY2VSZWFkZXIsIG1zY29ybGliLCBWZXJzaW9uPT.....5kIFtEdWVEYXRlXSA8PSAnQEN1cnJlbnREYXRlJwABEFRhc2tzU3RhdGVSZXBvcnQ=";
            this._resources = new DevExpress.XtraReports.Serialization.XRResourceManager(resourceString);
        }
        return this._resources;
    }
}
// ...
this.ScriptsSource = resources.GetString("$this.ScriptsSource");

Here, the scripts are not even in plain text. They have been serialised to the resources property.

The MainDemo.Reports assembly

You will find a new assembly MainDemo.Reports which contains a T4 template RepxToCSharp.tt. This is a T4 template which will search for repx files and transform them into much more helpful plain C#.

The template will run every time it is saved. Currently, it depends on code within the MainDemo.Reports assembly, so make sure you have compiled it in Debug mode. Then open the RepxToCSharp.tt and press Ctrl+S to save (and run the T4 transformation).

The output

The template will generate two types of output. First, it generates the following report which you should find in RepxToCSharp.txt

1
2
3
4
5
6
7
8
9
(This is an automatically generated file which should be excluded from version control)

Summary of repx transformation
==============================
Total repx files found                                      :  2
  Total reports generated                                   :  2
  Total reports skipped because unchanged                   :  0

Time elapsed: 00:00:02.1762029

In addition, each repx will have been transformed into two correpsonding files. All the generated files are highlighted in yellow:

Now the scripts have been deserialized from the repx and put in a partial class and the remainder of the repx has been transformed into a corresponding XafReport descendant. See for instance, ContactsGroupedByPosition.cs (which stored its scripts as a string) is as follows:

ContactsGroupedByPosition.cs
1
2
3
4
5
6
7
8
9
10
public partial class _ContactsGroupedByPosition
{
    // -- Start of embedded scripts -- 

    private void xrLabel4_BeforePrint(object sender, System.Drawing.Printing.PrintEventArgs e) {
      xrLabel4.Text = xrLabel4.Text + " Test!";
    }

    // -- End of embedded scripts --    
}

And TasksStateReport.cs is now like this

TasksStateReport.cs
1
2
3
4
5
6
7
8
9
10
11
12
13
14
15
16
17
18
19
20
public partial class _TasksStateReport
{
    // -- Start of embedded scripts -- 

    private void xrLabel1_BeforePrint(object sender, System.Drawing.Printing.PrintEventArgs e) {
        // This is a test
        xrLabel1.Text = "Hello";
    }

    private void xrLabel2_BeforePrint(object sender, System.Drawing.Printing.PrintEventArgs e) {
        xrLabel2.Text = GetLabel2Text();
    }

    public string GetLabel2Text()
    {
      return "Label 2!";
    }

    // -- End of embedded scripts --    
}

A note about performance

The process of transforming the repx into C# is quite quick (a couple of seconds per repx), but when you have dozens of reports, it can quickly be tiresome. Therefore, there is a performance optimisation which checksums the repx and skips the transformation if it has not changed.

(In a future version, we will also use a similar checksum in the other direction to determine whether the scripts have been modified).

Already much better

Now we have much more useful source files. Versions can be compared easily. The compiler will immediately inform us of any problems with the scripts within our reports.

This is work in progress. Next up, I will be adding the ‘reverse’. That is, a new transformation template which looks for scripts which have changed and ‘injects’ them back into the original repx file.

Fixing an Unmanaged Code AppCrash

| Comments

This post is the result of a recent bug hunt in which I came across a tricky bug, found a debugging switch I’d completely forgotten existed and learned a little about calling extern string functions from C#.

I love bug hunting. It’s like a murder mystery: you’ve got your suspects and you try to eliminate them one at a time until, as a famous bug hunter said:

… when you have eliminated the impossible, whatever remains, however improbable, must be the truth.

Sherlock Holmes The Sign of Four

Between about 1995 and 2006, I used a data library called Apollo almost every day. It was a bunch of C++ drivers for dBase files with some more advanced options for encryption and indexing and was a popular option for Clipper) programmers. I joined a software project which was based on Clipper and Apollo in 1995. Apollo went through many different incarnations SuccessWare, Luxent, Vista, ApolloDB. All of these companies were essentially providing wrappers for different languages (Delphi, .NET) but the core C++ drivers always remained more or less the same and it’s still going.

Fast forward to 2013 and we have a legacy console utility for migrating data from the old format, which traverses the Apollo tables and converts the data to our model (DevExpress XPO objects). This code hardly ever changes, but when I converted all our core libraries to .NET 4.5., I found I had to jump in and fix it one last time.

When I tried to run the upgraded .NET 4.5 library I got a mysterious app crash.

The application would then close without any error message or stack trace. Nothing I did was allowing me catch any exception. None of the signatures, e.g., the c0000374 exception code show up on Google. It shows up in the Windows event log, but apparently EventID 1000 is a very generic error message.

I had a suspicion the problem was something to do with the Apollo assembly and I also knew that Apollo was not all managed code. I stumbled over the Enable native code debugging in the project settings. I’ve never used this setting. (My next approach would have been to use tracing to try to pinpoint the location of the crash.)

Visual Studio really impresses with its debugging capabilities. When we run again, we get a stack trace and an error message.

Well Google didn’t seem to have much to say about ‘This may be due to a corruption of the heap’. But the problem seems to do with apolloTable.FieldName(i). With a decompiler I had a look at its definition.

1
2
3
4
5
6
public string FieldName(short fieldNum)
{
  //...
    return ApolloAPI.sx_FieldName(fieldNum);
    //...
}

Let’s find ApolloAPI.sx_FieldName(fieldNum);

1
2
[DllImport("SDE7.dll", CharSet=CharSet.Ansi, ExactSpelling=true)]
public static extern string sx_FieldName(short uiFieldNum);

Now, knowing that SDE7.dll is written in C++, I guessed it might be having trouble with the return value being a string. The C++ memory management of the returned string might be getting in the way. A bit of StackOverflow gave me this trick: declare the return type as IntPtr and use Marshal.PtrToStringAnsi() to get a C# string from the pointer. (It seems that .NET 4.5 is stricter about marshalling than earlier frameworks. Perhaps someone can enlighten me why the error did not occur with .NET 4.0?) I wrote a new extension method for ApolloTable and changed the code to use apolloTable.SafeFieldName(i) instead.

1
2
3
4
5
6
7
8
9
10
11
12
13
    public static class TApolloTableExtensions
    {
        [DllImport("SDE7.dll", CharSet = CharSet.Ansi, ExactSpelling = true)]
        public static extern IntPtr sx_FieldName(short uiFieldNum);

        public static string SafeFieldName(this ApolloTable apolloTable, short fieldNum)
        {
          //...
            IntPtr strPtr = sx_FieldName(fieldNum);
            return Marshal.PtrToStringAnsi(strPtr);
            //...
        }
    }

And bingo! The application now runs without error.

Load Testing XAF: Bonus - Simultaneous EasyTests

| Comments

In my recent series on load testing XAF, I used a Selenium javascript test to run the client browser instances. This is a good and cheap method of validating the performance of XAF applications under production load.

However, if the load tests fail because of a concurrency bug or a performance bottleneck, it can still be difficult to analyse and solve. For this, we need to be able to simulate load locally against the development environment.

In this post I will demonstrate how to run multiple simultaneous XAF EasyTests against a local server. As a load test, it is not very scientific, but it can be extremely useful as a debugging tool.

The EasyTest script

First, we will create a new EasyTest which will cycle through the existing navigation tabs. Open the XAF MainDemo and create a new EasyTest as follows.

MainDemo_CycleThroughTabs.ets
1
2
3
4
5
6
7
8
9
10
11
12
13
14
15
16
17
18
19
20
21
#Application MainDemoWeb

*FillForm
 User Name = Sam
 Password =
*Action Log On

*Action Navigation(Contact)
*Action Navigation(Task)
*Action Navigation(Department)
*Action Navigation(Scheduler Event)
*Action Navigation(My Details)
*Action Navigation(Note)
*Action Navigation(Payment)
*Action Navigation(Position)
*Action Navigation(Resume)
*Action Navigation(Role)
*Action Navigation(User)
*Action Navigation(Reports.Analysis)
*Action Navigation(Reports.Reports)
*Action Log Off

(This test replicates the Selenium test we created in Part 2 of my previous series on load testing with NeuStar and Amazon.) It is important to note that we are only testing the web application and that we do not include a #DropDB directive.

First, ensure that you can run this test with the default settings.

The config file

Now modify the config.xml file as follows:

Config.xml
1
2
3
4
5
6
7
8
9
10
11
12
13
14
15
16
17
18
19
20
21
22
<?xml version="1.0" encoding="utf-8" ?>
<Options xmlns:xsi="http://www.w3.org/2001/XMLSchema-instance" TestRunTimeLimit="5" >
  <Applications>
    <!-- Web -->
    <Application
      Name="MainDemoWeb"
      Url="http://localhost:4030"
      SingleWebDev="True"
      WebBrowserType="Standalone"
      PhysicalPath="[ConfigPath]\..\MainDemo.Web"
      AdapterAssemblyName="DevExpress.ExpressApp.EasyTest.WebAdapter.v12.2, Version=12.2.8.0, Culture=neutral, PublicKeyToken=b88d1754d700e49a"/>
    <!-- For IIS -->
    <!--<Application
      Name="MainDemoWeb"
      Url="http://localhost/MainDemo.Web/Default.aspx"
      PhysicalPath=""
      DontRestartIIS="True"
      DontRunWebDev="True"
      WebBrowserType="Standalone"      
      AdapterAssemblyName="DevExpress.ExpressApp.EasyTest.WebAdapter.v12.2, Version=12.2.8.0, Culture=neutral, PublicKeyToken=b88d1754d700e49a"/-->
  </Applications>
</Options>

There are a few important things to note.

I have not shown the Win section here since we are not using it. Also, I am using XAF 12.2.8. You may need to change the version number in the AdapterAssemblyName attribute. I have increased the TestRunTimeLimit attribute from 3 to 5. Everything goes a little slower when there are multiple browsers and we need to make sure the test does not time out.

With the above config, the EasyTest will no longer run from within Visual Studio.

You can choose to run the simultaneous tests against the debug web server or IIS. Uncomment the relevant section. The interesting settings are:

  • SingleWebDev="True" which instructs the EasyTest runner to run all tests against the same instance of the development webserver. Without this, the webserver would be stopped and started for each test.
  • WebBrowserType="Standalone" which causes each launched browser to be launched with its own session. (There are a few mentions of this setting in the support center, but it is not very well documented).
  • DontRestartIIS and DontRunWebDev which are self-explanatory

The launch command

Next, create the following batch file in the MainDemo.EasyTests subdirectory. ##

Launch.bat
1
2
3
4
5
6
7
8
9
10
11
12
13
14
15
16
17
18
19
20
21
22
23
24
25
26
27
28
29
30
31
32
33
34
35
36
37
38
39
40
41
42
43
44
45
46
47
48
49
50
51
52
:: Requires the Debug webserver to be running on port 49660
:: Requires EasyTests to be enabled
:: Requires NetDA to be running
:: Requires admin rights
:: Must be run from a command prompt
::
:: Usage: > launch <numberOfBrowsers>
:: e.g. : > launch 21
:: will launch 21 simultaneous browsers at 3 second intervals

@echo off

:DELETE_OUTPUT
if exist *.jpeg del *.jpeg
if exist *.html del *.html
if exist TestsLog.xml del TestsLog.xml

:CHECK_ADMIN
net session >nul 2>&1
if %ERRORLEVEL% equ 0 goto CHECK_CONSOLE
echo Must be run from an administrative command window
goto ERROR

:CHECK_CONSOLE
echo %CMDCMDLINE% | find /i "/c" >nul
if ERRORLEVEL 1 goto CHECK_PARAMS
echo Must be run from an administrative console (not Windows Explorer)
goto ERROR

:CHECK_PARAMS
IF [%1]==[] GOTO USAGE

:LAUNCH
set /a i=0

:LOOP
if %i%==%1 goto OK
set /a i=%i%+1
start "x" "C:\Program Files (x86)\DevExpress\DXperience 12.2\Tools\eXpressAppFramework\EasyTest\TestExecutor.v12.2.exe" MainDemo_CycleThroughTabs.ets
:: Wait 3 seconds
ping 1.1.1.1 -n 1 -w 3000 >nul
goto LOOP

:USAGE
echo Usage: %0 numberOfBrowsers
echo numberOfBrowsers must be an integer
goto OK

:ERROR

:OK
pause

If you want to run your tests against the development webserver, you will need to make sure it is running before launching the batch file. The easiest way to do this is to run the application from within Visual Studio and then close the browser. You should still see the development webserver running in the task bar notification area. Against IIS, it is enough to ensure it is started.

Now, open an administrative command prompt. Note that you must run from an administrative console: it is not sufficient to ‘run as administrator’ from Windows Explorer. Navigate to the EasyTest subdirectory where the Launch.bat file is located and launch a single test with the following command:

launch.bat 1

You should see the test run without error. If this works, you can then launch 20 simultaneous test runs with 3 second intervals by running:

launch.bat 20

Conclusion

As a load test, you do not get much useful information. Even if we managed to extract accurate data for client response times and throughput, the overhead of running the multiple browsers would skew the results too much. However, this approach is extremely useful for isolating concurrency and performance problems.

Load Testing XAF: Part 5 - Analysis

| Comments

This is the final post in a series about load testing XAF applications. Previously in the series:

In this part, we analyse the results of the load test we ran in Part 4.

Results

The results of the test we ran are here. The graphs are interactive and give quite interesting data about the load tests. Feel free to have a look and play around with the results.

The Performance Graphs

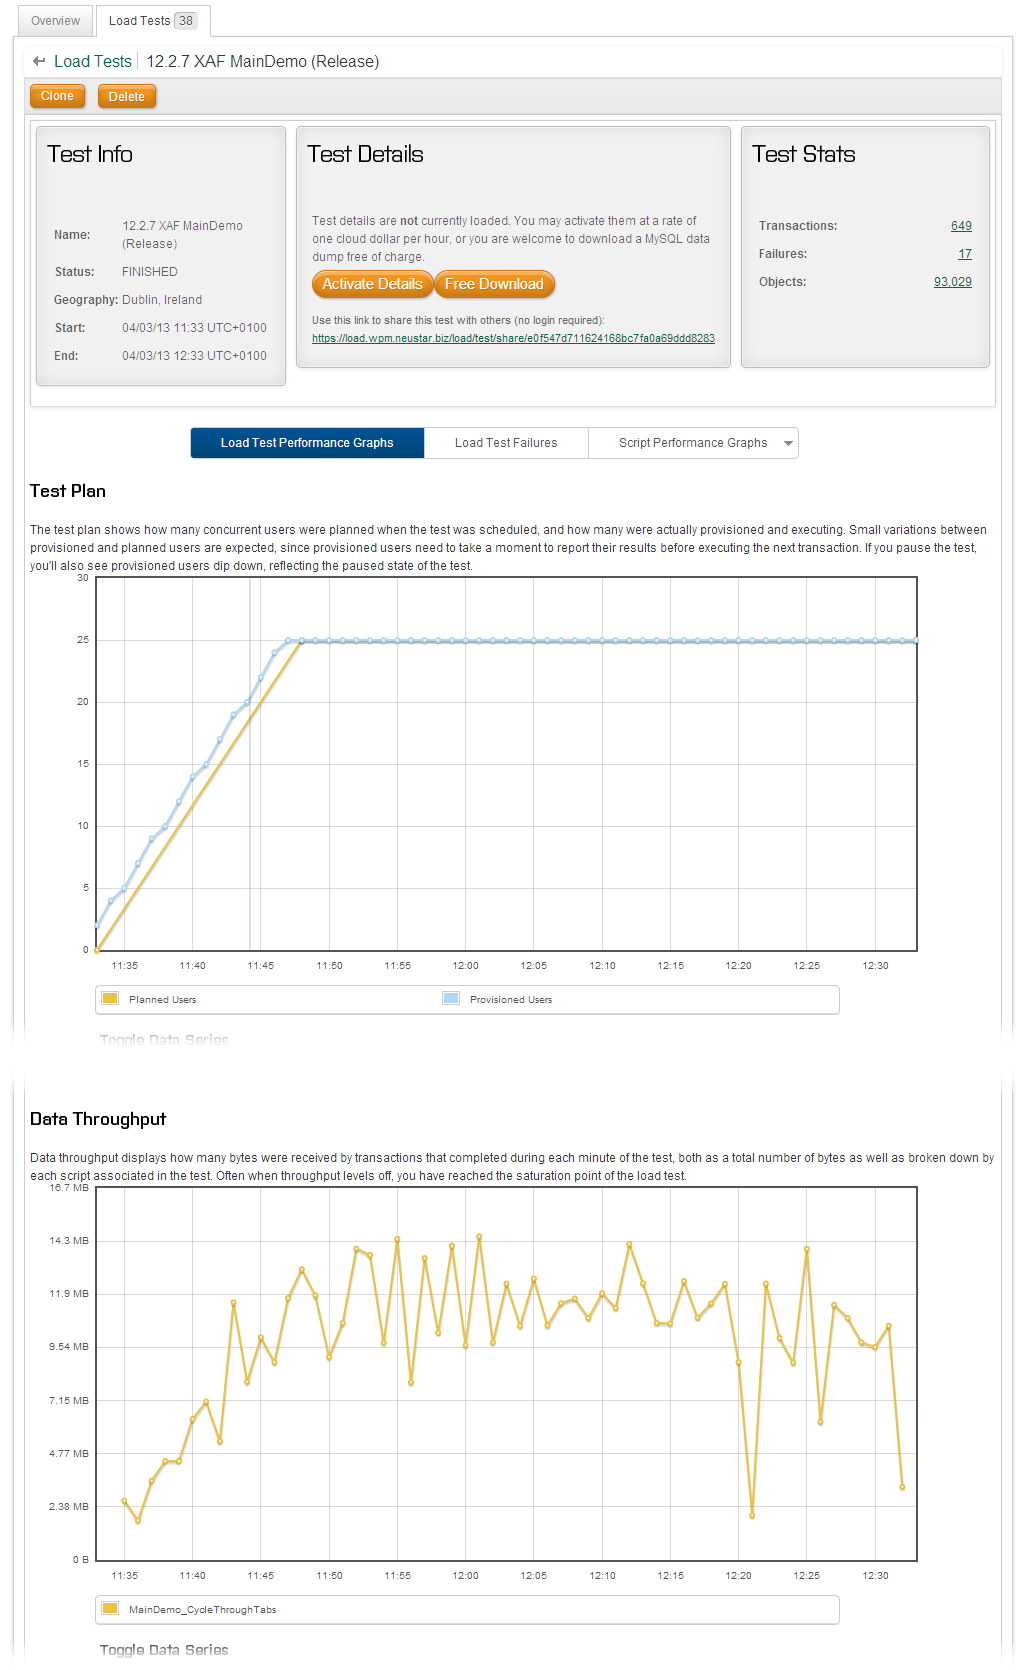
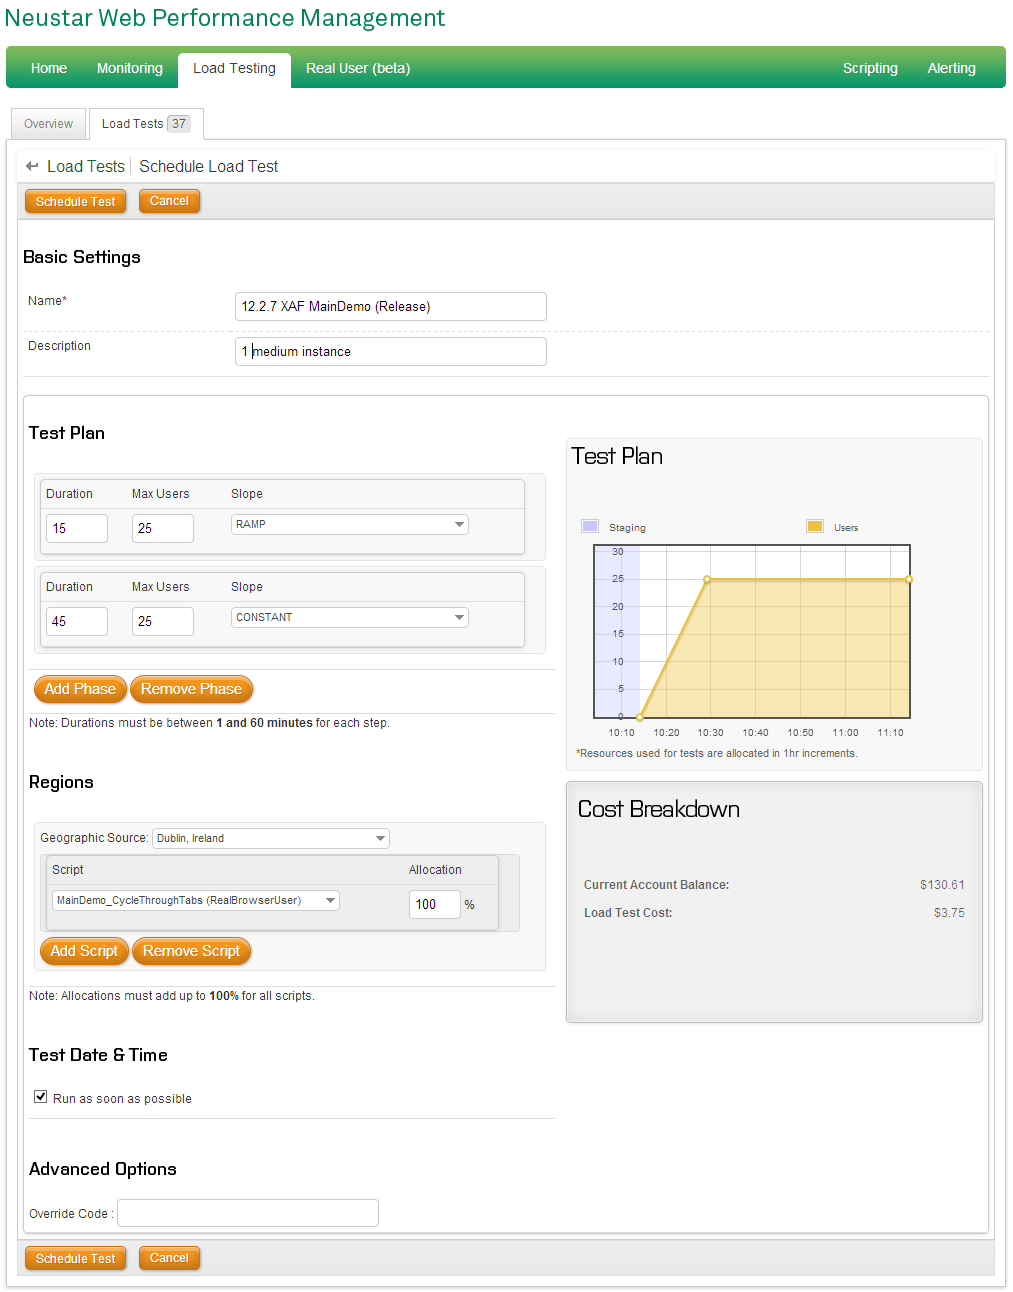
The above graph shows the basic information about the test. We can see there were 649 transactions (the Selenium script was run 649 times) and there were 17 errors.

You can see that the test managed to follow the planned scenario (the actual number of users follows the yellow line). You can also see information about the throughput in bytes during the test.

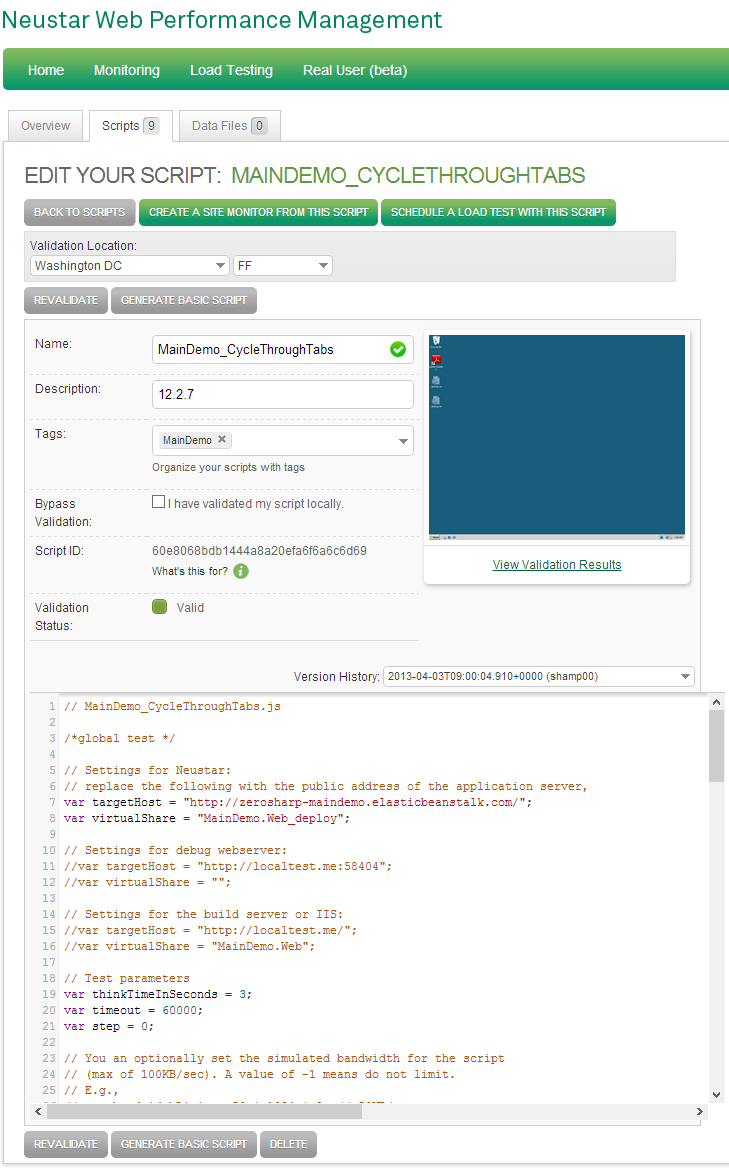
The Script Performance Graphs

Here we see information pertaining to the script we chose to run. Had we run multiple different scripts, we would be able to isolate each one.

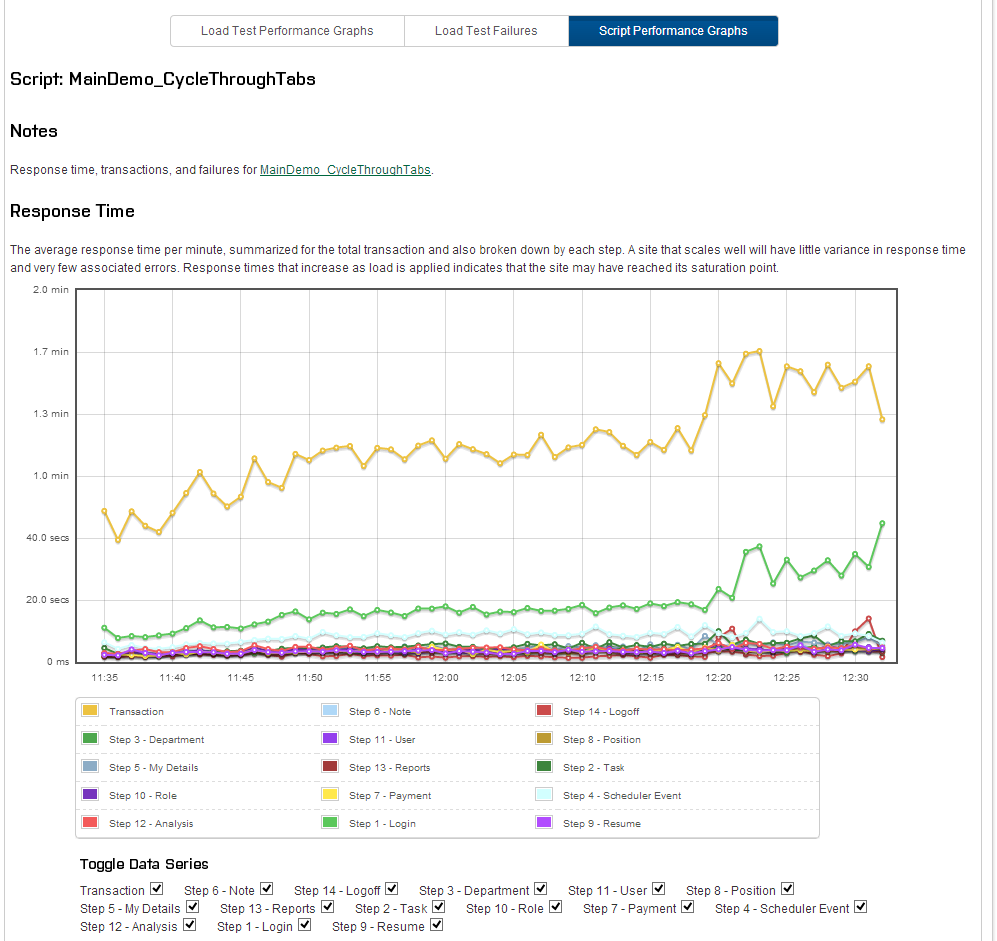
It is clear that the transaction time rises quite slowly with the load until about 12:17 when there is a jump. More on that later.

First, I have removed the plot of the total transaction time, so that we can see more detail from the remaining steps. Two things seem to be clear: the response time for each individual step does not seem to be much affected by the load, but the login step rises gradually.

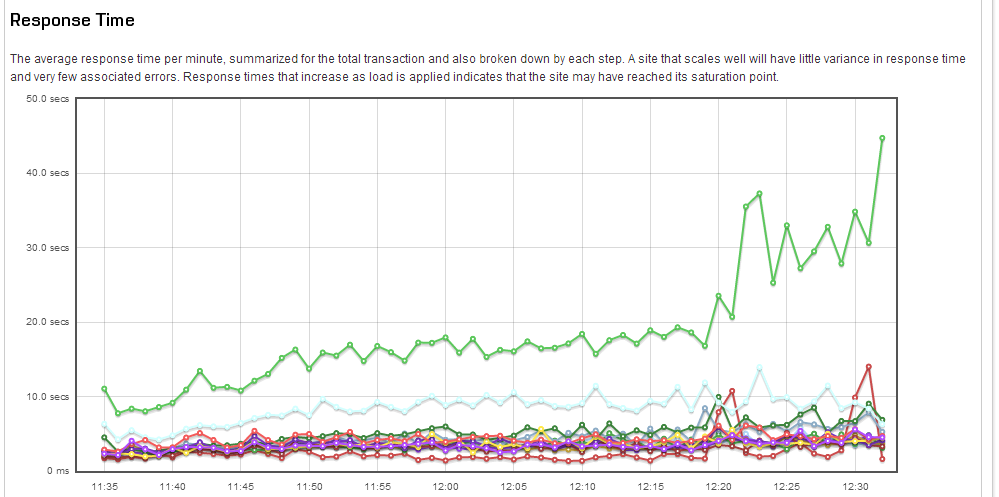
Now back to the spike at 12:17, if you look at the transaction data more closely (not shown here but available on the NeuStar results page, it looks like several transactions finished at the same time and that the jump coincides with several simultaneous logins.

So again, it seems that login is the ‘weakest link’, i.e., the most resource intensive step and the one that suffers the most under load.
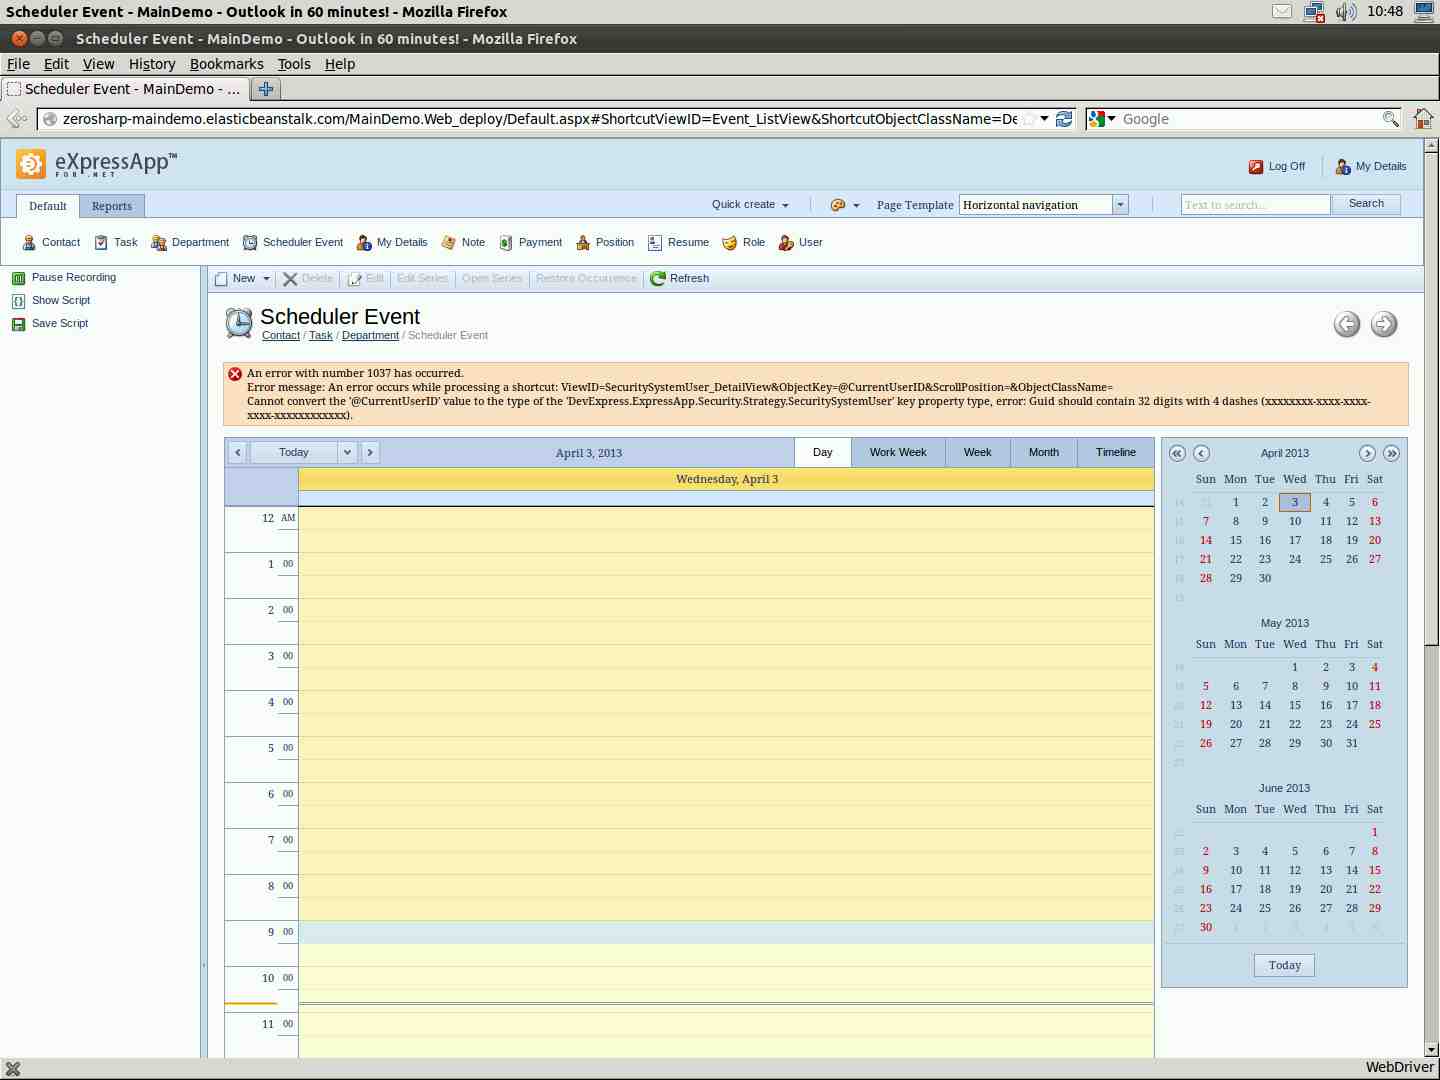
The Errors

Lets look more closely at the errors.

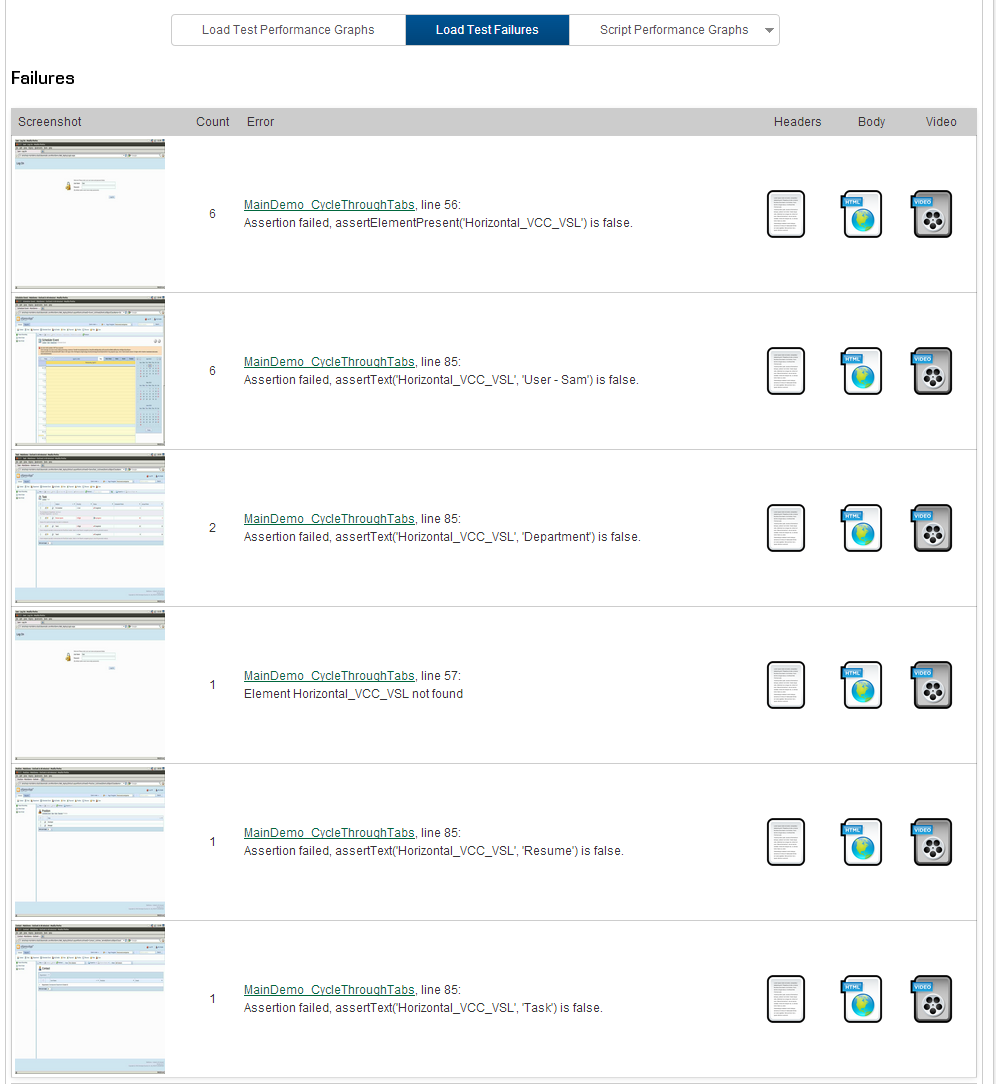
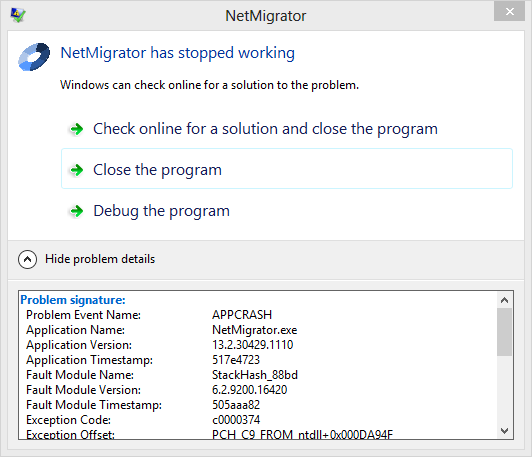
The first type of error we can see from the screen-shot occurred at the login page. This error happened 6 times and was very similar to another error which occurred once. In fact, all 6 of these errors happened at the very end of the test. As such, they can be ignored, because it is likely that the load test was scaling down and interrupting sessions at this point.

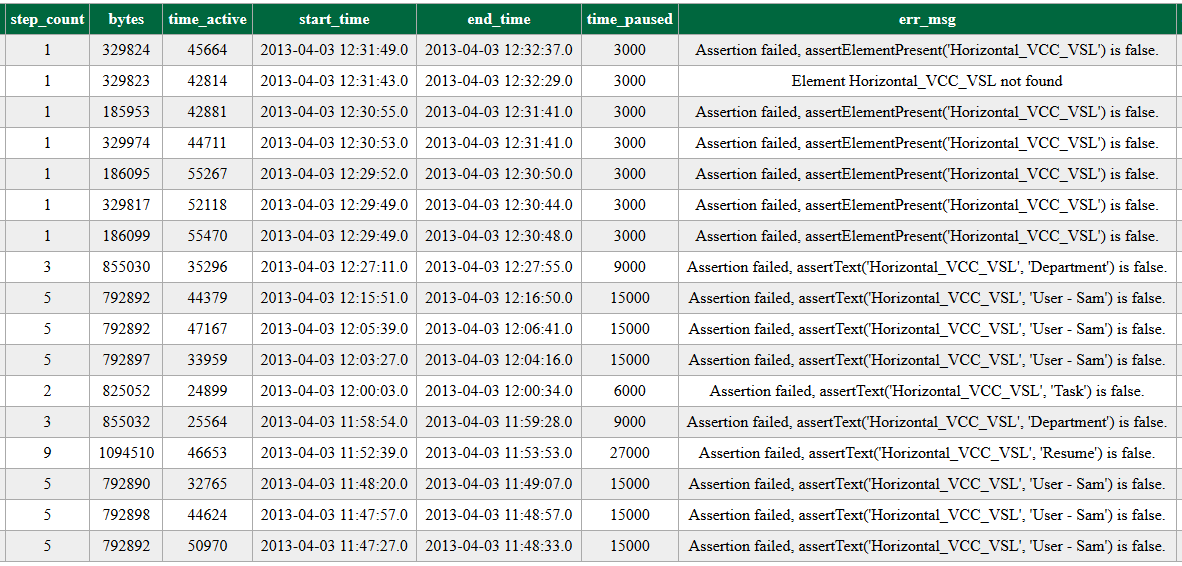
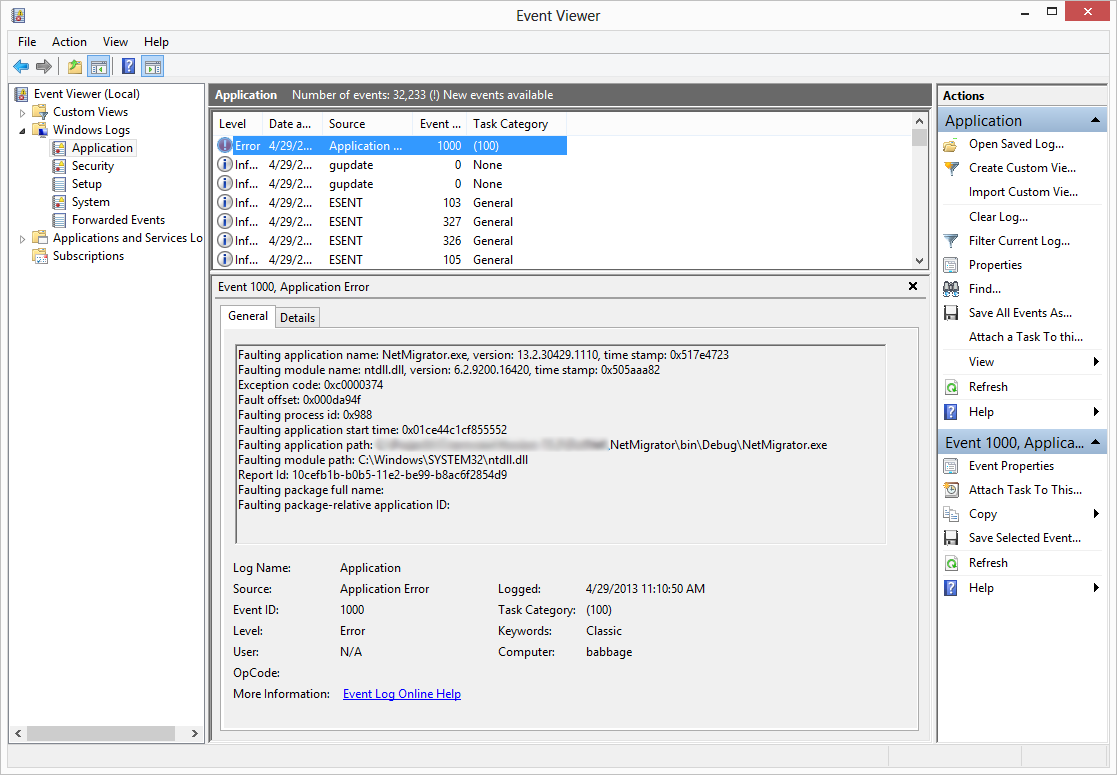
One of the very nice features of NeuStar’s load testing solution is that you not only get a screenshot, but also a video which shows you exactly what the user experienced when an error occurs. By clicking on the second error, it looks like there may be a problem when the system is under load. There were 6 errors and it is clear in the video that the errors occur when attempting to navigate away from the Scheduler Event view to the My Details view. The screen-shot gives us some useful information. DevExpress? Any ideas?

There are a couple of other errors, but I think these are most likely a result of problems with the Selenium script rather than XAF. The AJAX update panels make it quite hard to detect when the page is fully ready and although we try to accommodate this with selenium.waitForCondition() my feeling is that the click() occurred before everything was properly wired up.

Further tests

This series has covered the process of load testing XAF applications in its entirety, but in some ways, it feels like only the beginning. There are many other configurations and tests which would be interesting.

For instance

  • Reduce think time which is currently set to 3 seconds per step
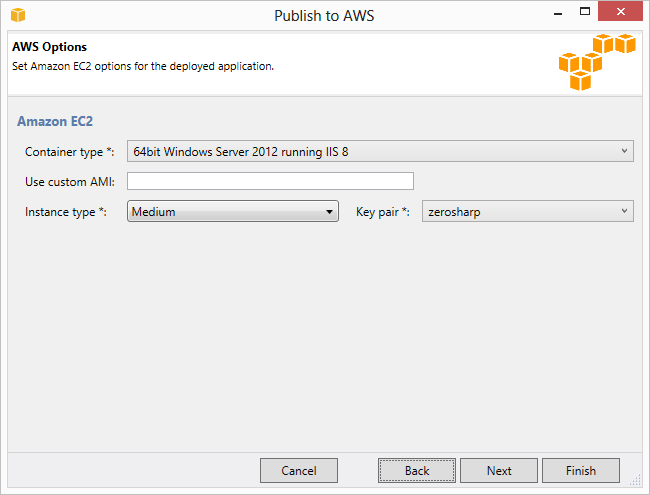
  • Use a smaller/larger EC2 instance
  • Increase the number of virtual users
  • Try load balancing with sticky sessions
  • Experiment with/without compression (IIS or via the web.config)
  • Experiment with/without caching (both at the http level, and via the cached data store

There are also many ways of improving XAF performance that are not in the MainDemo. These include:

  • Server mode in all grids
  • XPO Caching
  • Where possible, move any heavy operations to a separate asynchronous web service call

We have implemented all of these in our production application.

A note about concurrency

In our experience, people tend to over estimate the number of concurrent users for their application. Our application has probably upwards of 5000 users defined, but we know from our logs that there have never been more than 80 simultaneously logged in. Also, even with 80 concurrent users, they have a much longer ‘think time’ than 3 seconds on average.

For the production environment, we run at least one 25 user test for every major release and ensure the performance is at least as good as the previous release. We have occasionally run tests with up to 200 simultaneous users. The response time goes down to unacceptable levels (~30 seconds), but the application behaves. In production, the system is load balanced (with sticky sessions) and we know from previous experience that this is sufficient for our application.

Conclusion

This concludes my series on load testing. We’ve managed to get some very useful information with some very low-cost tools. The largest part of effort is the writing of the Selenium script which is certainly tricky. In the future I’d really like to harness the DevExpress EasyTests to replace the script but I haven’t yet found a way of doing this. Feel free to use my Selenium script as a starting point for testing your own XAF applications, and let us know of any interesting results!

Load Testing XAF: Part 4 - Launching the Load Test

| Comments

This is another post in a series about load testing XAF applications. Previously in the series:

In this part, we will launch a 1 hour test with 25 virtual users using the NeuStar Web Performance Management module.

Schedule and launch a test

From the script validation screen, click on Schedule a load test with this script. The defaults are good, but you can specify in detail how to run your load test. For instance, you can coordinate multiple Selenium scripts to simulate different types of activity on your site.

Notice that the load test cost for 25 users for an hour will be only $3.75.

When you click Launch, Neustar takes 7 or 8 minutes to provision the Amazon machines and stage the test, after which you will get realtime detail information about response times, bandwidth and errors.

In the next post we’ll analyse the results of this test.

Load Testing XAF: Part 3 - Uploading and Validating the Virtual User Script

| Comments

This is another post in a series about load testing XAF applications. Previously in the series:

In this part, we will load test the application we set up in Part 1, using the Selenium load test we created in Part 2.

Neustar Web Performance Management

NeuStar (formerly BrowserMob) are a company specialised in web application performance monitoring. We are interested in their web performance module. It is free to create an account. To run a test with less than 25 virtual users costs only $0.15 per virtual user. Tests with more than 25 users (up to 5000) require an additional paid plan.

Create a script

In order to run a load test, we first need to create the script and validate it. Go to the scripting page and select ‘Create a new script’. Then cut and paste the Selenium code for MainDemo_CycleThroughTabs.js from the previous post.

Now change the targetHost variable near the top of the file to point to the location of your MainDemo installation. You can then validate the script. This will actually run through the Selenium test on a newly provisioned Amazon instance to ensure that it passes.

If you get a green icon, you can proceed with setting up a load test, otherwise you can see what went wrong in a video of the user session.

In the next post we will configure and launch the load test.

Load Testing XAF: Part 2 - Selenium

| Comments

Writing a Selenium User Test against MainDemo

This is another post in a series about load testing XAF applications. Previously in the series:

Why not use DevExpress EasyTests?

The DevExpress recommended method of writing functional tests is to use the EasyTest functionality of the expressAppFramework. This has several advantages over other functional testing approaches.

  • It uses a domain specific language tailored for XAF making it easy to test views and actions
  • It makes it easy to interact with the DevExpress controls that are used within XAF
  • A single EasyTest can be run against both the ASP.NET and WinForms applications
  • EasyTests work against both the debug webserver and IIS

However, one feature which is not (yet) available is the ability to use EasyTests for load testing.

UPDATE: See my more recent post on how run multiple simultaneous EasyTests.

Modifications to the MainDemo

The sample script I have written assumes the MainDemo is running with Horizontal Navigation rather than vertical. You can modify the script to add support for vertical navigation or you can change Global.asax.cs Application_Start as follows:

1
2
3
4
5
6
7
8
protected void Application_Start(object sender, EventArgs e)
{
    RenderHelper.RenderMode = DevExpress.Web.ASPxClasses.ControlRenderMode.Lightweight;
    ASPxWebControl.CallbackError += new EventHandler(Application_Error);

+    // Add the following line to default to horizontal layout
+    WebWindowTemplateHttpHandler.PreferredApplicationWindowTemplateType = DevExpress.ExpressApp.Web.Templates.TemplateType.Horizontal;
}

The Selenium script

Selenium is a powerful tool for automating browsers. It supports all of the major browsers and a Selenium test can be written in many different programming languages (C#, Java, Javascript, HTML, etc.) The load testing tool (which we will come to in part 3 of this series) uses Selenium scripts written in Javascript.

We will now create and verify a simple Selenium test. The test will open the browser, login to the MainDemo and cycle through all of the tabs before logging out. The script is extremely basic. For a more realistic load test, you want a combination of scripts running, some entering data, some triggering reports, etc.

Create a \scripts subdirectory and populate it with the following code:

MainDemo_CycleThroughTabs.js
1
2
3
4
5
6
7
8
9
10
11
12
13
14
15
16
17
18
19
20
21
22
23
24
25
26
27
28
29
30
31
32
33
34
35
36
37
38
39
40
41
42
43
44
45
46
47
48
49
50
51
52
53
54
55
56
57
58
59
60
61
62
63
64
65
66
67
68
69
70
71
72
73
74
75
76
77
78
79
80
81
82
83
84
85
86
87
88
89
90
91
92
93
94
95
96
97
98
99
100
101
102
103
104
105
106
107
108
109
110
111
112
113
114
115
116
117
118
119
120
/* global test */

// Settings for Neustar:
// replace the following with the public address of the application server,
var targetHost = "http://zerosharp-maindemo.elasticbeanstalk.com/";
var virtualShare = "MainDemo.Web_deploy";

// Settings for debug webserver:
// (local script validator doesn't always work against localhost,
// so we use the excellent localtest.me instead.)
//var targetHost = "http://localtest.me:58404";
//var virtualShare = "";

// Settings for the build server or IIS:
//var targetHost = "http://localtest.me/";
//var virtualShare = "MainDemo.Web";

// Test parameters
var thinkTimeInSeconds = 3;
var timeout = 60000;
var step = 0;

// You an optionally set the simulated bandwidth for the script
// (max of 100KB/sec). A value of -1 means do not limit.
// E.g., 
// var bandwidthLimit = 50 * 1024 * 8; // 50KB/sec
var bandwidthLimit = -1;

var driver = test.openBrowser();
var selenium = driver.getSelenium();

// Support functions
function think() {
    if (thinkTimeInSeconds > 0) {
        if (!test.isValidation()) {
            test.pause(thinkTimeInSeconds * 1000);
        }
    }
}

function waitForCallbacks() {
    selenium.waitForCondition("(typeof selenium.browserbot.getUserWindow().xafHasPendingCallbacks === 'function') && (selenium.browserbot.getUserWindow().xafHasPendingCallbacks() === false);", timeout);
}


function stepLogin(username) {
    step = step + 1;
    test.beginStep("Step " + step.toString() + " - Login");
    selenium.open(targetHost + virtualShare + "/Default.aspx");
    think();
    selenium.type("xpath=//input[contains(@id,'_xaf_dviUserName_Edit_I')]", username);
    selenium.type("xpath=//input[contains(@id,'_xaf_dviPassword_Edit_I')]", "");
    selenium.click("Logon_PopupActions_Menu_DXI0_T");
    selenium.waitForPageToLoad(timeout);
    waitForCallbacks();
    selenium.assertElementPresent("Horizontal_VCC_VSL");
    selenium.waitForText("Horizontal_VCC_VSL", "Contact");
    test.endStep();
    think();
}

function stepLogoff() {
    var expectedSubstring;
    step = step + 1;
    test.beginStep("Step " + step.toString() + " - Logoff");
    selenium.click("//li[@class='dxm-item']/div[@class='dxm-content dxm-hasText']//a[@class='dx dxalink' and text()='Log Off']/..");
    selenium.waitForPageToLoad(timeout);
    expectedSubstring = "Logout.html";
    test.endStep();
}

function stepNavigateToTab(maintabCaption, tabCaption, viewCaption) {
    // viewCaption is optional
    viewCaption = (typeof viewCaption === "undefined") ? tabCaption : viewCaption;
    step = step + 1;
    test.beginStep("Step " + step.toString() + " - " + tabCaption);
    selenium.waitForElementPresent("//td[@class='dxtc' and text()='" + maintabCaption + "']");
    if (selenium.isVisible("//td[@class='dxtc' and text()='" + maintabCaption + "']")) {
        selenium.click("//td[@class='dxtc' and text()='" + maintabCaption + "']");
    }
    selenium.waitForElementPresent("//div[@class='dxm-content dxm-hasText' and starts-with(@id, 'Horizontal_NTAC_PC_M')]//a[@class='dx dxalink' and contains(text(), '" + tabCaption + "')]/..");
    selenium.click("//div[@class='dxm-content dxm-hasText' and starts-with(@id, 'Horizontal_NTAC_PC_M')]//a[@class='dx dxalink' and contains(text(), '" + tabCaption + "')]/..");
    waitForCallbacks();
    selenium.assertElementPresent("Horizontal_VCC_VSL");
    selenium.assertText("Horizontal_VCC_VSL", viewCaption);
    test.endStep();
    think();
}

function initializetest() {
    selenium.setTimeout(timeout);
    if (bandwidthLimit > 0) {
        test.setSimulatedBps(bandwidthLimit);
    }
}

(function main() {
    initializetest();

    test.beginTransaction();

    stepLogin("Sam");
    //stepNavigateToTab("Default", "Contact");
    stepNavigateToTab("Default", "Task");
    stepNavigateToTab("Default", "Department");
    stepNavigateToTab("Default", "Scheduler Event");
    stepNavigateToTab("Default", "My Details", "User - Sam");
    stepNavigateToTab("Default", "Note");
    stepNavigateToTab("Default", "Payment");
    stepNavigateToTab("Default", "Position");
    stepNavigateToTab("Default", "Resume");
    stepNavigateToTab("Default", "Role");
    stepNavigateToTab("Default", "User");
    stepNavigateToTab("Reports", "Analysis");
    stepNavigateToTab("Reports", "Reports");
    stepLogoff();
    test.closeBrowser();

    test.endTransaction();
}());

Neustar

In a future post we will create multiple test runners in the Amazon cloud using the Neustar web performance tool (formerly BrowserMob). Neustar will gather statistics about each scripts reponse times and provide a load test report including details of any test failures.

For now we will verify locally that the Selenium script above works as expected.

Installing the Neustar local script validator

In order to verify that our script is supported by the Neustar framework, we need to install their local script validator. Download it and unzip it to a subdirectory of the MainDemo.

There are instructions for setting up local script validation here.

To run the script locally call the following:

> script-validator-4.8.81\bin\validator.bat CycleThroughTabs.js -keepbrowseronerror

I had some problems getting the NeuStar script validator to work in 64-bit Windows 8. The script validator instructions recommend FireFox 12 but I am using version 19. For the record I am using:

  • DevExpress MainDemo 12.2.7
  • NeuStar localscriptvalidator 4.8.81
  • Mozilla FireFox 19
  • Java 7.0.90

You need to modify your C:\Users\<Username>\.wpm\config.properties file as follows:

config.properties
1
FF=C:\\Program Files (x86)\\Mozilla Firefox\\firefox.exe

Also, for some reason, I could not get the local script validator to run against localhost. I kept getting the error:

1
2
3
4
WARN 03/28 12:38:28 b.n.w.a.s.JavaScrip~ - Got script exception
org.mozilla.javascript.WrappedException: Wrapped biz.neustar.webmetrics.agent.ap
i.HttpErrorException: No valid HTTP Response received while navigating to URL 'h
ttp://localhost:58404/Default.aspx' (CycleThroughTabs.js#50)

The easiest solution was to change the localhost address in the javascript file to the excellent localhost alternative localtest.me.

Now when I run the script using the local validator with

> validator cyclethroughtabs.js

I see Firefox startup after a few seconds and the script correctly cycles through all of the tabs and then exits.

We will use this scenario as the basis of a load test in the next post.

Load Testing XAF: Part 1 - Deploying

| Comments

This is the first part of a tutorial about load testing XAF applications. See the overview for a bit of background. In this post we set up the target webserver.

You can target any machine which has a publicly available web address, but for this tutorial, I’m’ deploying the MainDemo to the Amazon cloud, by following the instructions in Part 1 and Part 2 of my previous series about Amazon Web Services.

I am using version 12.2.7 of the DevExpress XAF MainDemo. There are a couple of extra changes to make to the web.config.

  • Set debug to false <compilation targetFramework="4.0" debug="false"> in the <compilation> section of <system.web>
  • Switch to Release mode before deploying.

There are a couple of differences compared to the tutorial:

  • I chose a Medium instance instead of a Micro instance for EC2 (the web server) and deployed it against IIS 8.
  • For RDS (the database), I stuck with a Micro instance.

For the load test, it is also important to disable the automatic health checks performed by the load balancer.

The reason for this is that we are trying to determine the breaking point of our application. If the elastic load balancer detects that a system is struggling, it might automatically flag it as unhealthy and replace it with a newly launched instance. While this behaviour might be desirable for a production system, it doesn’t make sense for a load test.

Make sure you can connect to your installation from a web browser before continuing. I chose to deploy to a Windows 2012 instance running IIS 8.0 (which was not available when I wrote my previous XAF AWS tutorial) and I had a little trouble with the URL. If I navigate to the application’s base URL (http://zerosharp-maindemo.elasticbeanstalk.com/ in my case), then I get forwarding problems after logging in. Instead, I navigate to the full address http://zerosharp-maindemo.elasticbeanstalk.com/MainDemo.Web_deploy/Default.aspx and everything works. I’ll try to look into it later, but it’s not important for the load testing.